Notes and Examples for Python
 | Notes and Examples for Python |
For Linux the packages numpy, scipy, Gnuplot, and matplotlib should be in usr/lib/Python2.x/site-packages.
1-d Arrays, Matrices, Numerical Integration, Numerical Solution of ODEs, Curve Fitting, Fit to line, Reading and Writing Array files, Finding zeros of functions, Graphing with Gnuplot, Fast Fourier Transform, Waveforms: Square, Sawtooth, Time Delay, Noise, Create Postscript Graph, Simple Plots with matplotlib, Plot Functions and Data, Interactive Plots with matplotlib, Plotting with log or linear axes, Subplots, 2 Y axes, Inset Graph


Instructions for installing a python-based system for scientific/mathematic use, here
Good references: http://www.scipy.org/Cookbook, for example, to learn plotting: http://www.scipy.org/Cookbook/Matplotlib, for gnuplot, see demo.py and test.py in the gnuplot-py directory
To learn about packages, subpackages, and routines, run python from a terminal, then follow these example commands to learn about the scipy package:
To make programs executable for Linux 1st line of program is:
#! /usr/bin/env python {and change permissions to include execute}
May be useful to run as:
python filename.py --verbose-helpful
Programs should load packages as follows:
from scipy import *
from numpy import *   # This not necessary since scipy loads numpy
from numpy.random import *   # If need random number generator
import Gnuplot              # If use gnuplot for graphs
from matplotlib import *    # If use matplotlib for graphs
from pylab import *
Note, if using Gnuplot.py, then gnuplot must also be installed. http://www.gnuplot.info
To enter values interactively use raw_input(text). (Doesn't work on emacs!! Use Eric)
x = float(raw_input('Enter x value: ')) #converts text input into real.
x = arange(0,10)   # To make integer array vector of x values.
x = linspace(0,10,101)    # To make more general array.
y = x**2
x=zeros(100,float)    # creates x array filled with 0
from scipy import *
from scipy.linalg import *
from numpy.random import randn

#Example of using 2-dim arrays as matrices

#Nr=6;Nc=4         # Number of rows and columns
Nr=4;Nc=Nr         # Square matrix
A=zeros([Nr,Nc])      # Makes a Nr by Nc matrix of zeros
#A=ones([Nr,Nc])

print A

for i in arange(0,Nr):
    for j in arange(0,Nc):
        A[i,j]=i+j

print A

print ' Now make array of random numbers and do some linear algebra functions'

A = randn(Nr,Nc)
B = trace(A)     #Really only for square matrix
C = det(A)       #determinant
D = inv(A)       #inverse
print A
print 'Trace = ',B,'   determinant = ', C
print D
print 'Now should get identity matrix from A x Inv(A)'
print dot(A,D)  #This does matrix multiplication as opposed to element
Example: To include Time Delay
import time
time.sleep(2.0)   #Causes 2.0 second delay.
Example: Numerical integration
from scipy import *
from scipy.integrate import quad
"""
Example of integration of a function using quad
Do the exponential function.
"""
result = quad(lambda x: exp(-x),0,5)   #Uses anonymous function, lambda
disp(['Numerical result: ',result])
analytic = 1-exp(-5)
disp(['Analytic result: ',analytic])
Example: Numerical solution of ODEs
from scipy import *
from scipy.integrate import odeint
from pylab import *
"""
Example of solving system of differential equations using odeint.
Do the damped oscillator, b is damping coefficient
"""
def damped_osc(u,t,b):   #defines the system of odes
    x=u[0]; v=u[1]
    return(v,-x-b*v)     #the derivatives of u

t = linspace(0,30,400)
u0 = [1,0]
b = 0.3

u=odeint(damped_osc,u0,t,args=(b,)) #b is in tuple, needs comma

figure(1)
plot(t,u)                 #plots both columns of u
xlabel('Time'); title('Damped Oscillator')
figure(2)
plot(u[:,0],u[:,1])
title('Phase-space'); xlabel('Position'); ylabel('Velocity')
show()
OR try
from scipy import *
from scipy.integrate import ode
from pylab import *

"""Example using ode integrator, Lorenz equations"""

def foo(t,y,p):                 #system of 1st order ode
    sigma=p[0]; beta=p[1]; rho=p[2]
    dy = zeros([3])
    dy[0] = sigma*(y[1]-y[0])
    dy[1] = y[0]*(rho - y[2])-y[1]
    dy[2] = y[0]*y[1]-beta*y[2]
    return dy

t0 = 0; tEnd = 100.0; dt = 0.01
y0 = [5,-5,10]                  #Initial conditions
Y=[]; T=[]                      #create empty lists
p = [10.0,8.0/3.0,28.0]         #parameters for odes

#Set up integrator 'vode'.  Non-stiff use Adams, stiff use bdf
r = ode(foo).set_integrator('vode',method='adams')
#r = ode(foo).set_integrator('vode',method='bdf')

#Maybe future version of scipy will have Runge-Kutta methods dopri5 and dop853
#r = ode(foo).set_integrator('dopri5')

r.set_f_params(p).set_initial_value(y0,t0)

while r.successful() and r.t+dt < tEnd:
    r.integrate(r.t+dt)
    Y.append(r.y)        #makes a list of 1d arrays
    T.append(r.t)

Y = array(Y)        #convert from list to 2d array

subplot(2,1,1)
plot(T,Y)
subplot(2,1,2)
plot(Y[:,0],Y[:,2])
show()
from scipy import *
from matplotlib import *
from pylab import *
from scipy.optimize import leastsq
"""
Example of curve fitting for
a1*exp(-k1*t) + a2*exp(-k2*t)
"""
def dbexpl(t,p):
    return(p[0]*exp(-p[1]*t) + p[2]*exp(-p[3]*t))
a1,a2 = 1.0, 1.0
k1,k2 = 0.05, 0.2
t=arange(0,100,0.1)
data = dbexpl(t,[a1,k1,a2,k2]) + 0.02*randn(len(t))
def residuals(p,data,t):
    err = data - dbexpl(t,p)
    return err
p0 = [0.5,1,0.5,1] # initial guesses
guessfit = dbexpl(t,p0)
pbest = leastsq(residuals,p0,args=(data,t),full_output=1)
bestparams = pbest[0]
cov_x = pbest[1]
print 'best fit parameters ',bestparams
print cov_x
datafit = dbexpl(t,bestparams)
plot(t,data,'x',t,datafit,'r',t,guessfit)
xlabel('Time')
title('Curve-fitting example')
grid(True)
show()
from scipy import *
from scipy import optimize
from pylab import *

"""Least squares fit to straight line
   Also demonstrates useful text placement"""

fitfunc = lambda p, x: p[0]*x + p[1]      #straight line
errfunc = lambda p, x, y: fitfunc(p,x) - y  #error to minimize

x=array([1,2,3,4,5])
y=array([0.8,2.1,2.8,4.1,5.2])

p0 = array([0,0])
p1 = optimize.leastsq(errfunc,p0, args=(x,y),full_output=1)
m,b = p1[0]
mesg = p1[3]
ier = p1[4]
print 'Best fit slope and intercept ',p1[0]
print ier,' ',mesg
fit=fitfunc(p1[0],x)

ax=subplot(1,1,1)
plot(x,y,'x',label='data')
plot(x,fit,'-',label='fit')
legend()
text(0.1,0.9,'slope = '+str(m),transform=ax.transAxes)
text(0.1,0.85,'intercept = '+str(round(b,3)),transform=ax.transAxes)
xlabel(r'$x$')
ylabel(r'$y$')
show()
Example: File IO, Reading and writing arrays
from scipy import *
"""
Example of file io, reading and writing array files. Does csv format.
"""
x=arange(0,10)
y=exp(-0.2*x)*cos(2*pi*x/20.)
data=column_stack((x,y))
print data
filename="test_io.txt"
savetxt(filename,data,delimiter=',',fmt='%.8e')
A = genfromtxt(filename,delimiter=',')
print A
print "done"
Example: Simple Plots with matplotlib To trouble-shoot, use command line $ python filename.py --verbose-helpful
from scipy import *
from pylab import *
"""
Shows how to put a couple of plots on a graph using matplotlib
"""
x = linspace(0,10,50)           #Define x-range: 0 to 10 with 50 points
y = x**2                         # Function x squared
z = 5*x                          # Function 5x

#plot using blue circles with line, and red x's no line
plot(x,y,'bo-',label='$x^2$',markersize=8.0,linewidth=2.0)
plot(x,z,'rx',label='$5x$',markersize=10.0,linewidth=2.0)
legend()
xlabel('x axis')
ylabel('y axis')
title('Simple Graph')
grid(True)
show()
Example: Plots Functions and Data
from scipy import *
from pylab import *

#Shows how to plot functions and data points

x = linspace(0, 10, 100)        #Define x-range: 0 to 10 with 100 points
y = x**2                        # Function x squared
z = 5*x                         # Function 5x

#plot functions using blue line, and red dashed line
plot(x,y,'b-',label='$x^2$',linewidth=2.0)
plot(x,z,'r--',label='$5x$',linewidth=2.0)

#Include some "data" plotted with black (k) circles
xdat=[0,2,4,6,8,10]
ydat=[1,5,15,38,60,98]
plot(xdat,ydat,'ko',label='data',markersize=8.0)

legend(loc=2)          #puts legend in upper left corner
xlabel('x axis')
ylabel('y axis')
title('Simple Graph')
grid(True)
show()
Example: Interactive Plots with matplotlib
#!/usr/bin/env python
from scipy import *
import matplotlib
matplotlib.use('TkAgg')	  #Try this to work best in linux. Or qt4agg, or gtkagg
from pylab import *

print """Example of interactive plotting with matplotlib's pyplot.
Won't work correctly on Windows using IDLE.  Run from Command Prompt Window"""

x = linspace(0,1,200)       #Defines array of x values from 0 to 1

f = 2
ion()              #Turns interactive mode on.
ans=''
while ans != 'q':
    y = sin(2*pi*f*x)
    plot(x,y,'o-')
    draw()         #Need this to work on linux?

    ans=raw_input('f = '+repr(f)+'. Enter new f, or q: ')
    if ans != 'q':
        f = float(ans)
        clf()       #Clears the figure
ioff()

close()            #Closes the figure

#Use following 2 lines instead of close() if want figure to remain.

#print 'Remember to close figure window.'
#show()
Example: Switching between log and linear axes on plots
#! /usr/bin/env python
from __future__ import division
from scipy import *
import matplotlib
matplotlib.use('TkAgg')     #or maybe qt4agg, or gtkagg
from pylab import *

print "Example of switching between log and linear axes
Won't work correctly on Windows using IDLE.  Run from Command Prompt Window"

RC = 1e-3
f=logspace(1,5)          #good for logarithmic axes

ans=' '
ion()
while ans != 'q':
    y=1/sqrt(1+(2*pi*f*RC)**2)
    plot(f,y,'b+-')
    grid(True)
    draw()
    ans=raw_input('Enter log, lin, RC, q: ')
    if ans == 'log':
        semilogx()
    if ans == 'lin':
        delaxes()
    if ans =='RC':
       RC=float(raw_input('Old RC = '+repr(RC)+'. Enter new RC: '))
       clf()

close()
ioff()
from scipy import *
from pylab import *

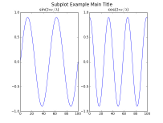
"""Example for subplots"""

x=linspace(0,100,200)
y1=0.9*sin(2*pi*x/25)
y2=0.9*cos(2*pi*x/20)

subplot(1,2,1)
suptitle('Subplot Example Main Title',fontsize='16')
plot(x,y1)
title(r'sin($2\pi x/ \lambda$)')

subplot(1,2,2)
plot(x,y2)
title(r'cos($2\pi x/ \lambda$)')

show()
from scipy import *
from pylab import *

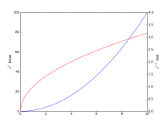
"""Example with 2 y axes"""

x=linspace(0,10,200)
y1=x**2

y2=sqrt(x)

subplot(111)
plot(x,y1,'b')
ylabel(r'$x^2$ blue',fontsize=14)

twinx()
plot(x,y2,'r')
ylim([0,4])
ylabel(r'$x^{1/2}$ red',fontsize=14)

show()
from scipy import *
from pylab import *

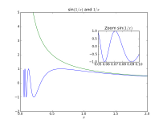
"""Example with inset graph"""

x=linspace(0.05,2,2000)
y=sin(1/x)
y2=1/x

plot(x,y,x,y2)
xlabel(r'$x$',fontsize=14)
ylim([-2,5])
title(r'sin$(1/x)$ and $1/x$')

axes([0.6,0.5,0.25,0.25])
plot(x,y)
xlim([0.05,0.1])
title(r'Zoom sin$(1/x)$')

show()
Example: Finding zeros of nonlinear functions using fsolve
from scipy import *
from scipy.optimize import fsolve
from matplotlib import pylab
from pylab import *
"""
Use fsolve to find intersections of exp(x)-1 with cos(x)
Note that need different guesses to find different intersections
"""
def f(x):
    return (exp(x)-1)-cos(x)
result = fsolve(f,-1.5)
print result
x = linspace(-5,1,101)
plot(x,exp(x)-1,x,cos(x))
grid(b=1)
show()
Example: Plotting using Gnuplot
#!/usr/bin/env python
from numpy import *
import Gnuplot
"""
Demonstrates how to use gnuplot for graphs. Plots 2 graphs with different styles.
"""
x = linspace(0,10,31)
y = x**2
y2 = 10*sin(pi*x)
g = Gnuplot.Gnuplot() #!! Won't be able to use 'with' in python 2.6?
d = Gnuplot.Data(x,y,title='squared', with='lp lt 1 pt 6')
d2=Gnuplot.Data(x,y2,title='sine',with='p pt 7 ps 4')
g('set grid')
g.xlabel('x axis')
g.ylabel('y axis')
g.plot(d,d2)
ans = raw_input('Enter f to create .png file, or Enter to quit ')
if ans == 'f':
    g.hardcopy('filename.png',terminal = 'png')
    #g.hardcopy('filename.ps',terminal='postscript',enhanced=1,color=1)
g.reset()
from scipy import *
from pylab import *
"""
Test the fft routine. Add signals, and multiply signals.
"""
npts = 512            #Use some power of 2
t=linspace(0,1,npts+1)     # Use 2^N + 1
dt = (t[-1]-t[0])/(len(t)-1)    # Maximum frequency is 1/2dt ?
fmax = 1/(2*dt)
f1 = 80
f2 = 90
#sig = 1 + sin(2*pi*f1*t) + 1 + sin(2*pi*f2*t)  # sum of signals
sig=(1+sin(2*pi*f1*t))*(1+sin(2*pi*f2*t))      # product of signals

figure(1)
plot(t,sig);xlabel('Time');title('Signal')

ft = fft(sig,n=npts)
mgft=abs(ft)             #Get magnitude of fft
df = fmax/float(npts/2)
f=linspace(0,fmax,npts/2+1)
print 'fmax = ',fmax,' df = ',df,' ','\n 1st freqs = ',f[0:5]

figure(2)
plot(f,mgft[0:npts/2+1]);title('Fast Fourier Transform Magnitude')
xlabel('frequency')
ylabel('fft magnitude')
show()
Example: Make a square or sawtooth wave using scipy.signal.waveforms
#! /usr/bin/env python
from scipy import *
from scipy.signal.waveforms import sawtooth
from pylab import *

# Make a square wave or sawtooth. Graph it or save data file
# Use sawtooth from scipy, but define our own square wave function

def sqr(t,duty):
    f = 0
    if mod(t,2*pi) < duty*2*pi: f = 1
    return f
square=vectorize(sqr)

t = linspace(0,0.01,501)
f = 700
A = 2.8
duty = 0.5

# Uncomment the desired waveform
y = A*square(2*pi*f*t,duty)
#y = A*sawtooth(2*pi*f*t,width=0.5)

ans = raw_input('Enter g for graph, \n'+
          'd to make data .csv file, \n or press enter ')

if ans== 'g':
    figure(1)
    plot(t,y,'-')
    show()

if ans == 'd':
    filename = raw_input('Enter filename for data file ')
    data=column_stack((t,y))
    savetxt(filename,data,delimiter=',',fmt='%.8e')
#! /usr/bin/env python
from numpy import *
from numpy.random import normal
from pylab import *
"""
Make signal with gaussian noise
"""
npts=200
x=linspace(0,10,npts)
theory=5*sin(2*pi*x/2.0)
noise=normal(0,1,npts)  #mean, std dev, num pts
sig=theory+noise

plot(x,theory,'-',x,sig,'+')
show()